Note
Go to the end to download the full example code
Random noise#
Unlike the prior examples, most real world data have noise. Noise can occur in both the regrassands and regressors depending on how data is acquired.
Typical types of noise include:
Random measurement error, which can occur on both the regrassands and the regressors (for instance if both come from observed measurements)
Gross outliers which can occur for many reasons
In this example, we’ll explore adding Gaussian distributed random noise to the data and seeing the impact this has on the estimated parameters.
import numpy as np
import matplotlib.pyplot as plt
from regressioninc.linear.models import add_intercept, OLS
from regressioninc.testing.complex import ComplexGrid, generate_linear_grid
from regressioninc.testing.complex import add_gaussian_noise, plot_complex

np.random.seed(42)
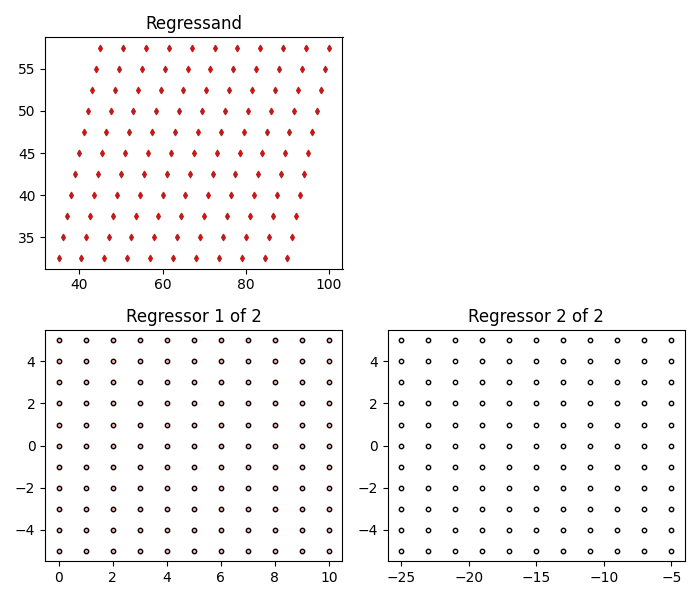
Let’s setup another linear regression problem with complex values.
params = np.array([0.5 + 2j, -3 - 1j])
grid_r1 = ComplexGrid(r1=0, r2=10, nr=11, i1=-5, i2=5, ni=11)
grid_r2 = ComplexGrid(r1=-25, r2=-5, nr=11, i1=-5, i2=5, ni=11)
X, y = generate_linear_grid(params, [grid_r1, grid_r2], intercept=20 + 20j)

fig = plot_complex(X, y, {})
fig.set_size_inches(7, 6)
plt.tight_layout()
plt.show()
Estimating the parameters using least squares gives the expected values.
X = add_intercept(X)
model = OLS()
model.fit(X, y)
for idx, params in enumerate(model.estimate.params):
    print(f"parameter {idx}: {params:.6f}")

fig = plot_complex(X, y, {"least squares": model})
fig.set_size_inches(7, 9)
plt.tight_layout()
plt.show()
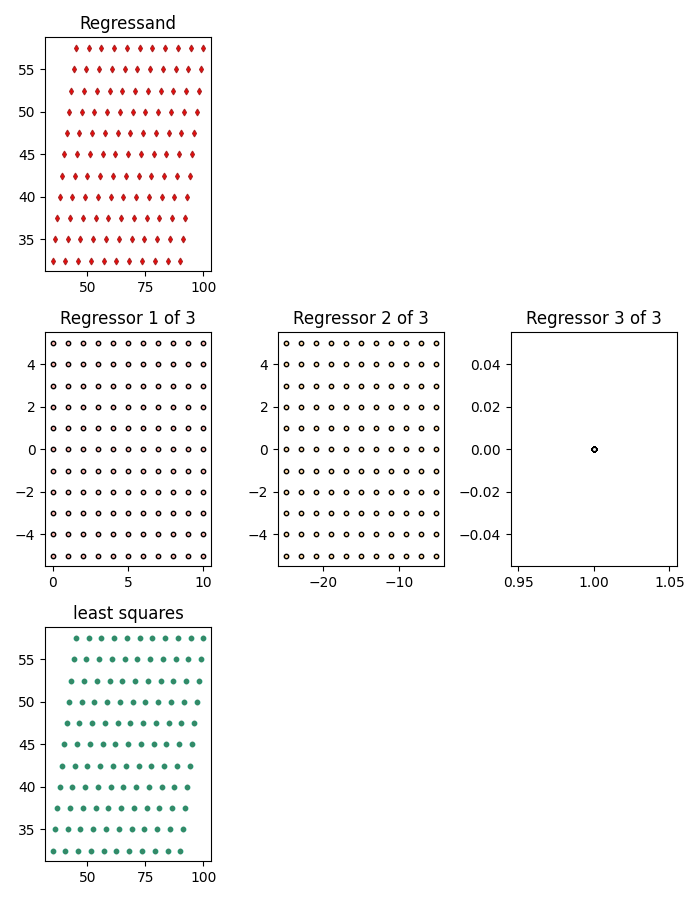
parameter 0: 0.500000+2.000000j
parameter 1: -3.000000-1.000000j
parameter 2: 20.000000+20.000000j
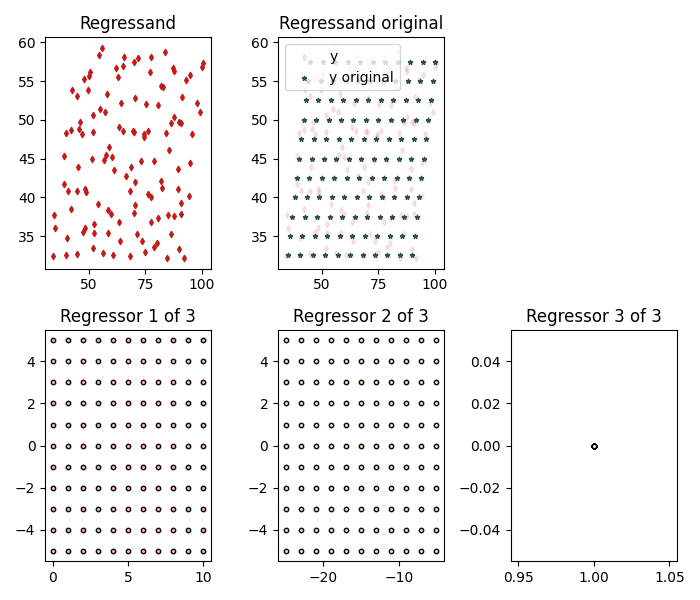
Add some Gaussian distributed random noise to the observations and let’s see what they look like now.
y_noise = add_gaussian_noise(y, loc=(0, 0), scale=(3, 3))

fig = plot_complex(X, y_noise, {}, y_orig=y)
fig.set_size_inches(7, 6)
plt.tight_layout()
plt.show()
Now let’s try and estimate the parameters again but with the noisy regrassands. In this case, the parameter estimates are slightly off the actual values due to the presence of the noise. Note that least squares is the maximum likelihood estimator for Gaussian random noise. However, with other types of noise, there may be more effective regression methods.
model = OLS()
model.fit(X, y_noise)
for idx, params in enumerate(model.estimate.params):
    print(f"parameter {idx}: {params:.6f}")

fig = plot_complex(X, y_noise, {"least squares": model}, y_orig=y)
fig.set_size_inches(7, 9)
plt.tight_layout()
plt.show()
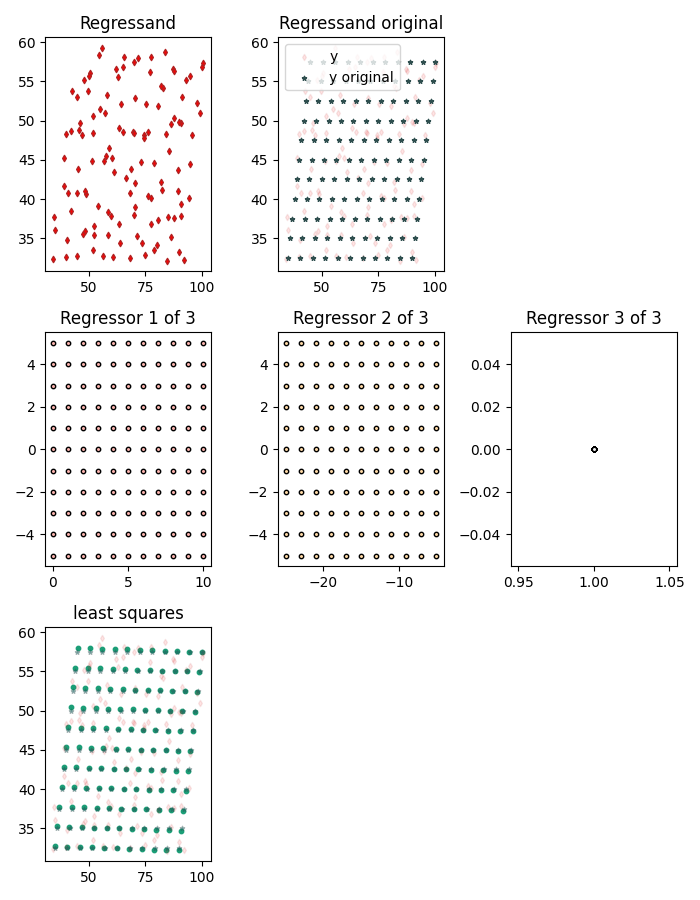
parameter 0: 0.416040+1.964015j
parameter 1: -2.949279-0.955329j
parameter 2: 21.072774+20.942814j
Total running time of the script: (0 minutes 3.406 seconds)